
The Longevity Gap · Do women outlive men everywhere?
Do women
outlive men
everywhere?
In 264 countries tracked from 1960 to 2022, the answer is yes — but the magnitude ranges from less than one year in Togo to more than thirteen years in Ukraine. The gap is not just an average. It is a fingerprint of every society, written into the date of death.
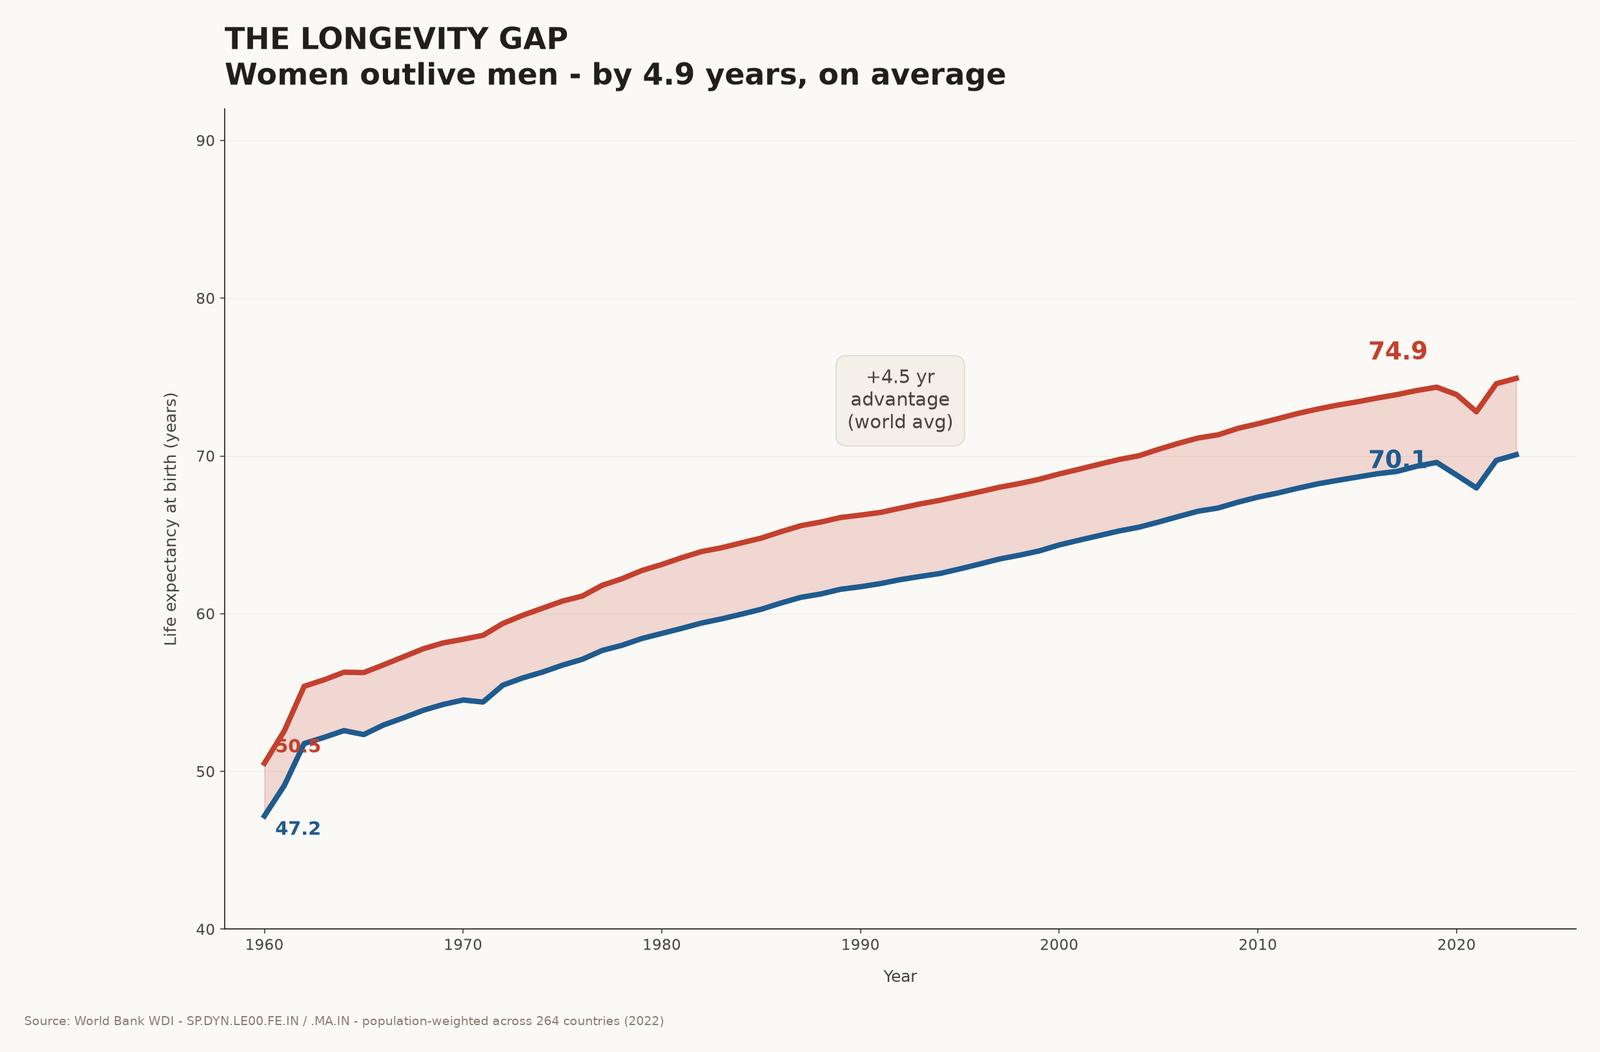
The gap has been widening since 1960.
In 1960, the average woman lived about three and a third years longer than the average man. Today she lives almost five years longer. The two lines on this chart are the entire world — every country, weighted by its population.
Men have gained more than two decades of life in that time. So have women. But women have gained slightly more — and the cumulative result is a gap that keeps growing.
The gap is not uniform. It is geography.
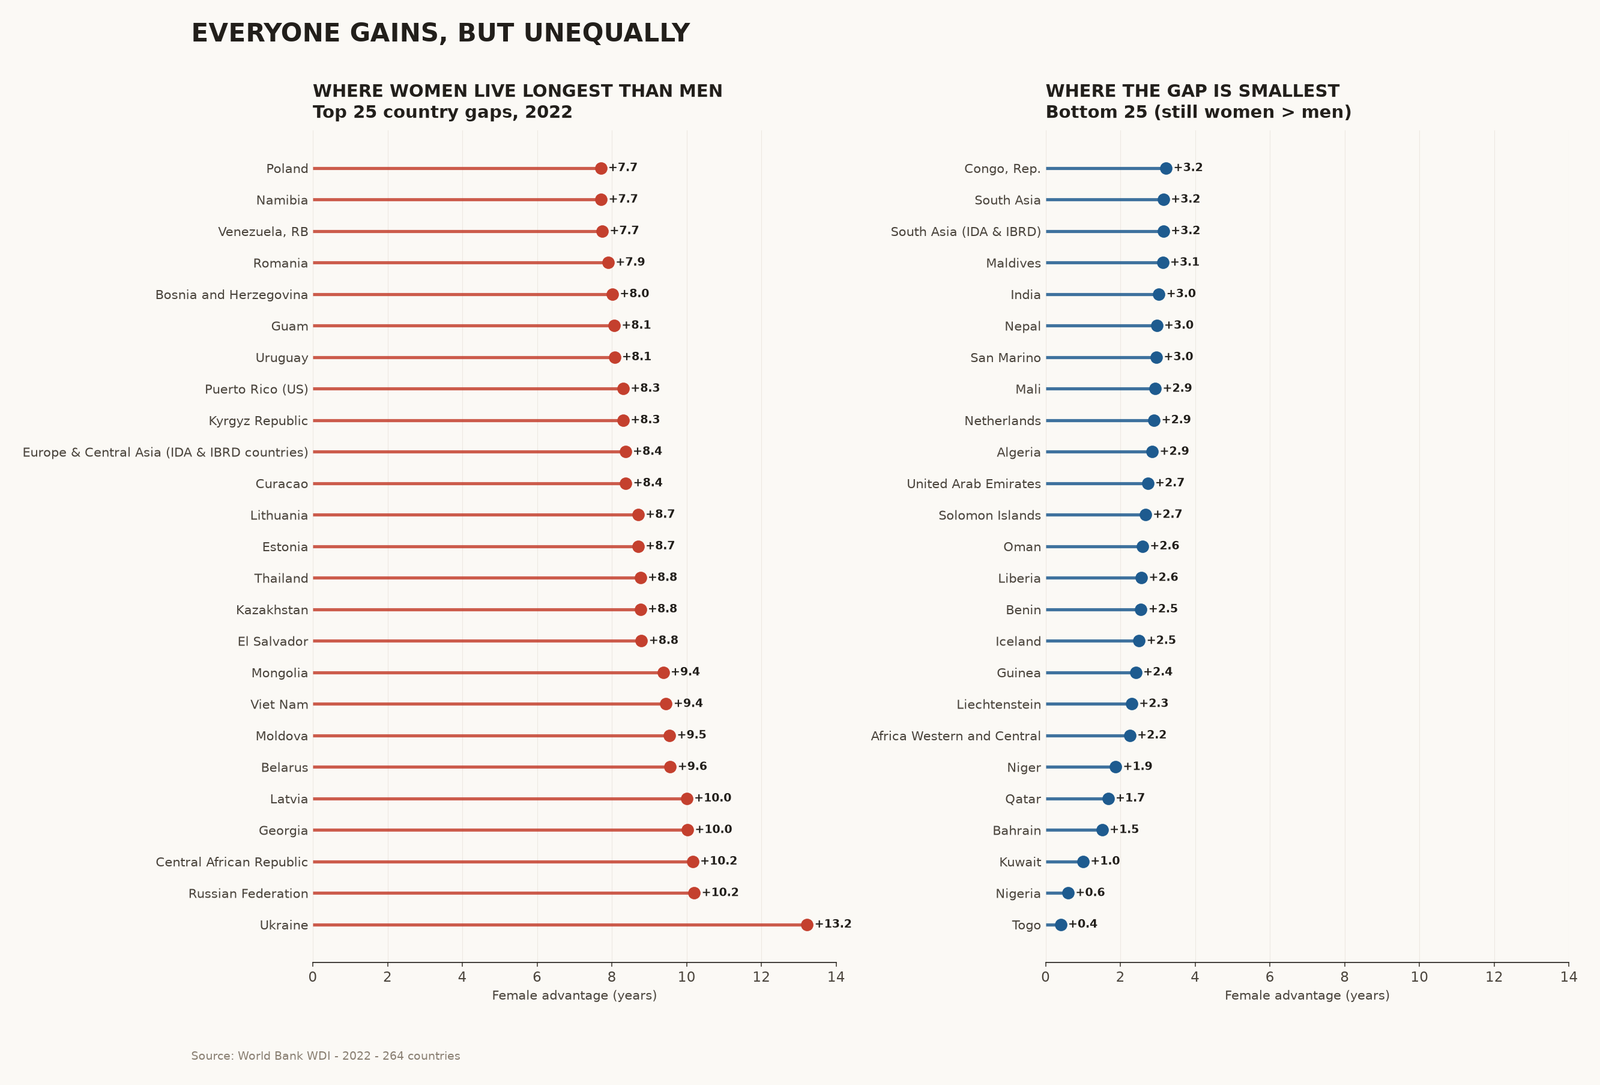
Look country by country and the average collapses. Ukraine, Russia, Belarus, the Baltics — gaps of nine to thirteen years. Central African Republic and other low-LE countries — similar. Then a long tail of countries where the gap is barely one or two years.
The cause is not biology. Biology gives us roughly two years. Everything beyond that is behaviour, policy, alcohol, smoking, traffic, war, and the chronic stress of being a man in a society that treats masculinity as a death wish.
Where you live shapes how long you live.
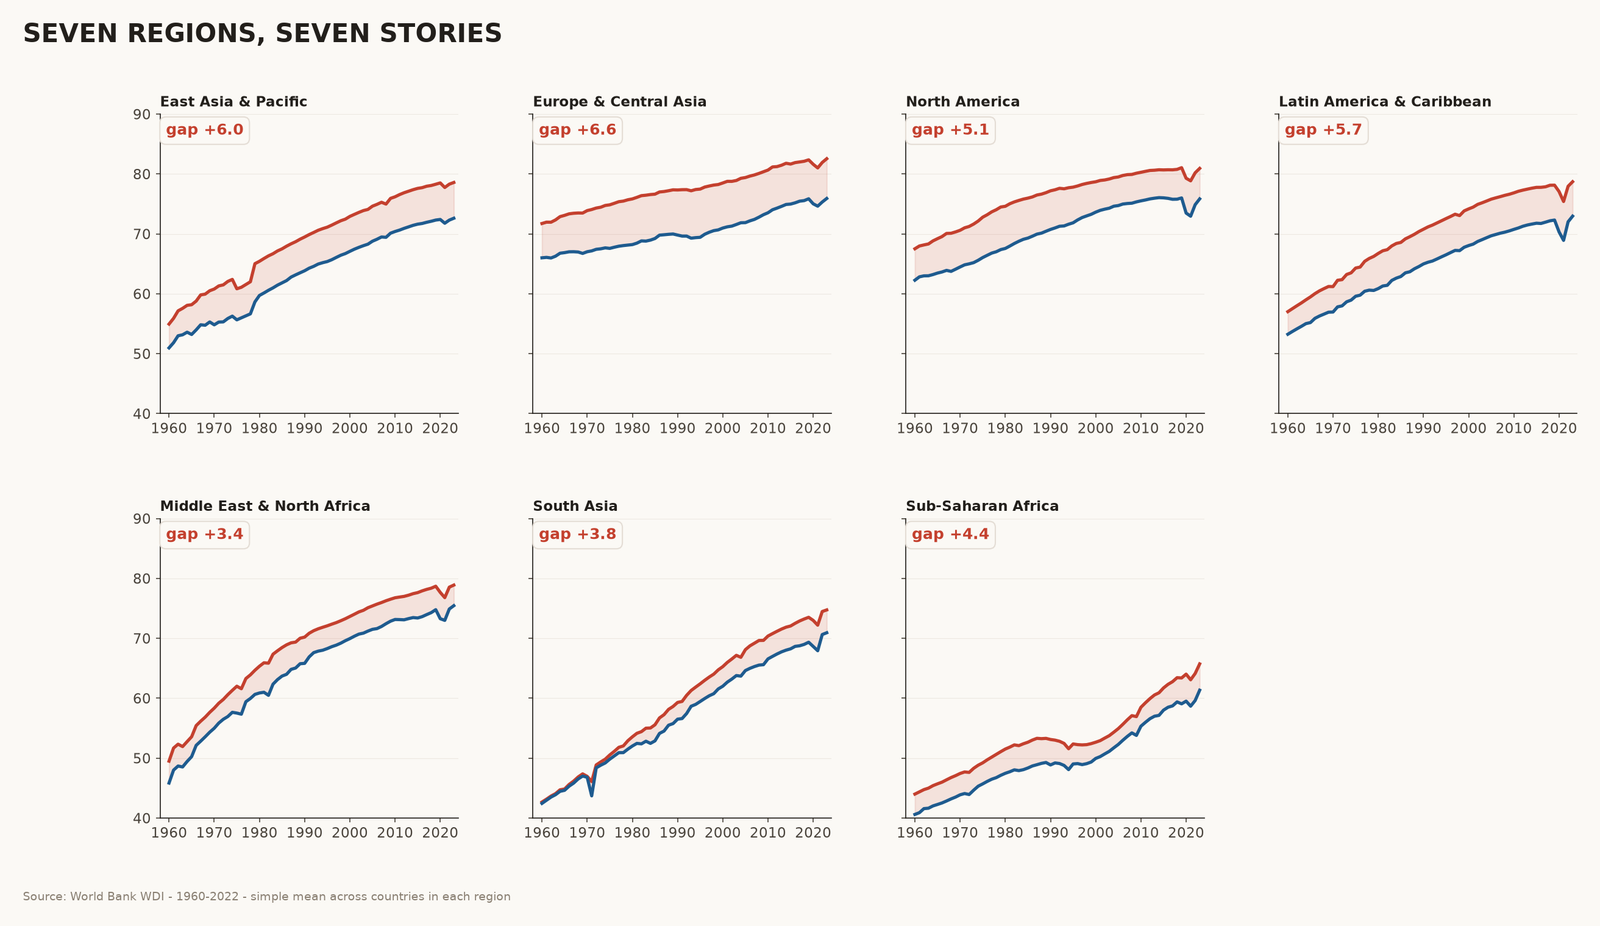
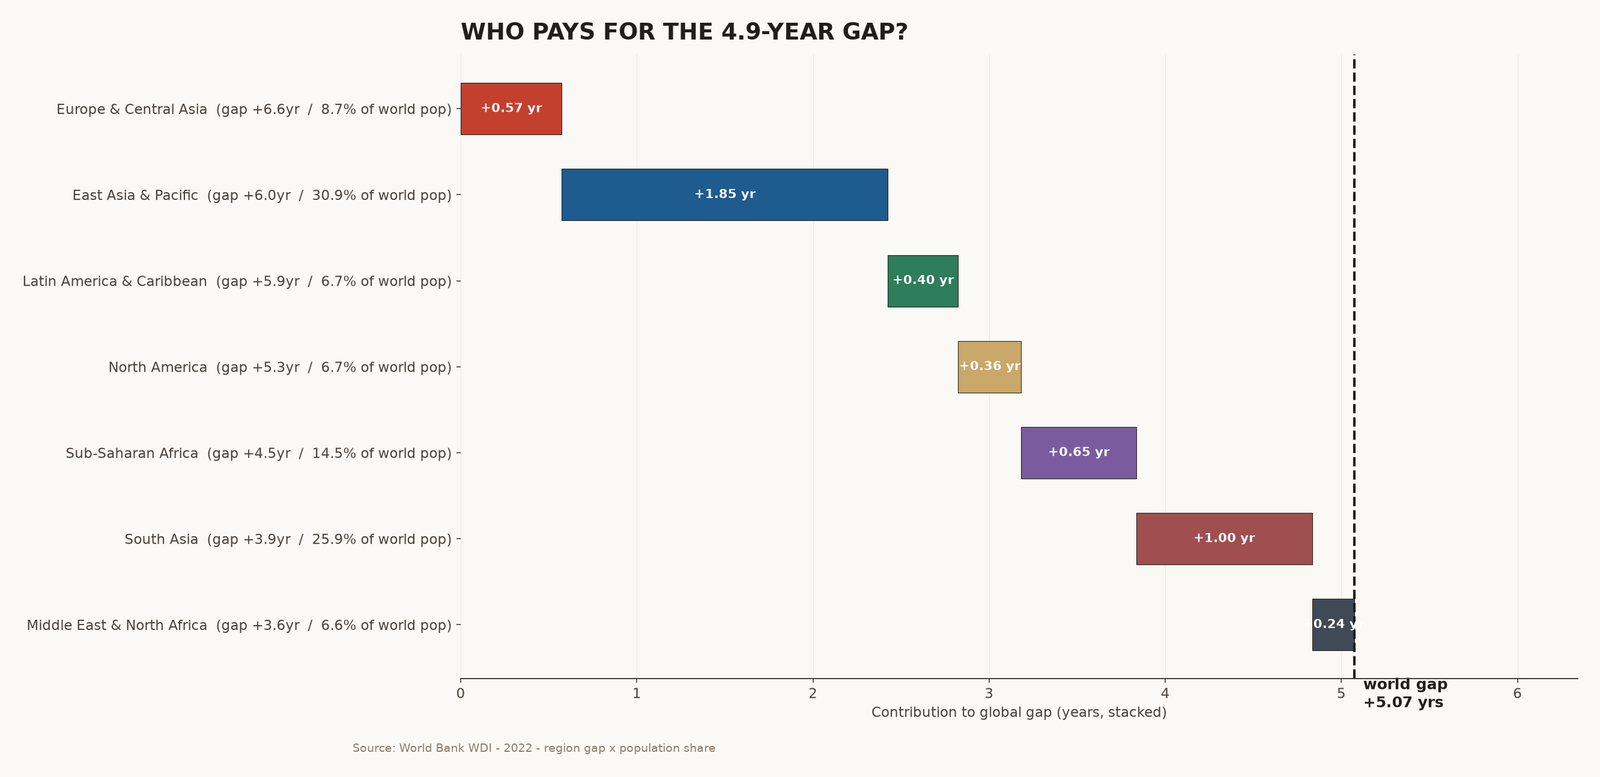
Seven world regions, seven different stories. The widest regional gap is in Europe & Central Asia — mostly the post-Soviet states, where alcohol and the legacy of industrial-era smoking still echo. The narrowest is in the Middle East & North Africa, where male LE is unusually high.
| REGION (2022) | FEMALE LE | MALE LE | GAP | COUNTRIES |
|---|---|---|---|---|
| Europe & Central Asia | 81.9 | 75.3 | +6.6 | 21 countries |
| East Asia & Pacific | 78.3 | 72.3 | +6.0 | 14 countries |
| Latin America & Caribbean | 78.0 | 72.0 | +5.9 | 18 countries |
| North America | 80.2 | 74.9 | +5.3 | 3 countries |
| Sub-Saharan Africa | 64.1 | 59.6 | +4.5 | 35 countries |
| South Asia | 74.5 | 70.6 | +3.9 | 8 countries |
| Middle East & North Africa | 78.5 | 74.9 | +3.6 | 18 countries |
The gap is not just wider. It is wider for everyone.
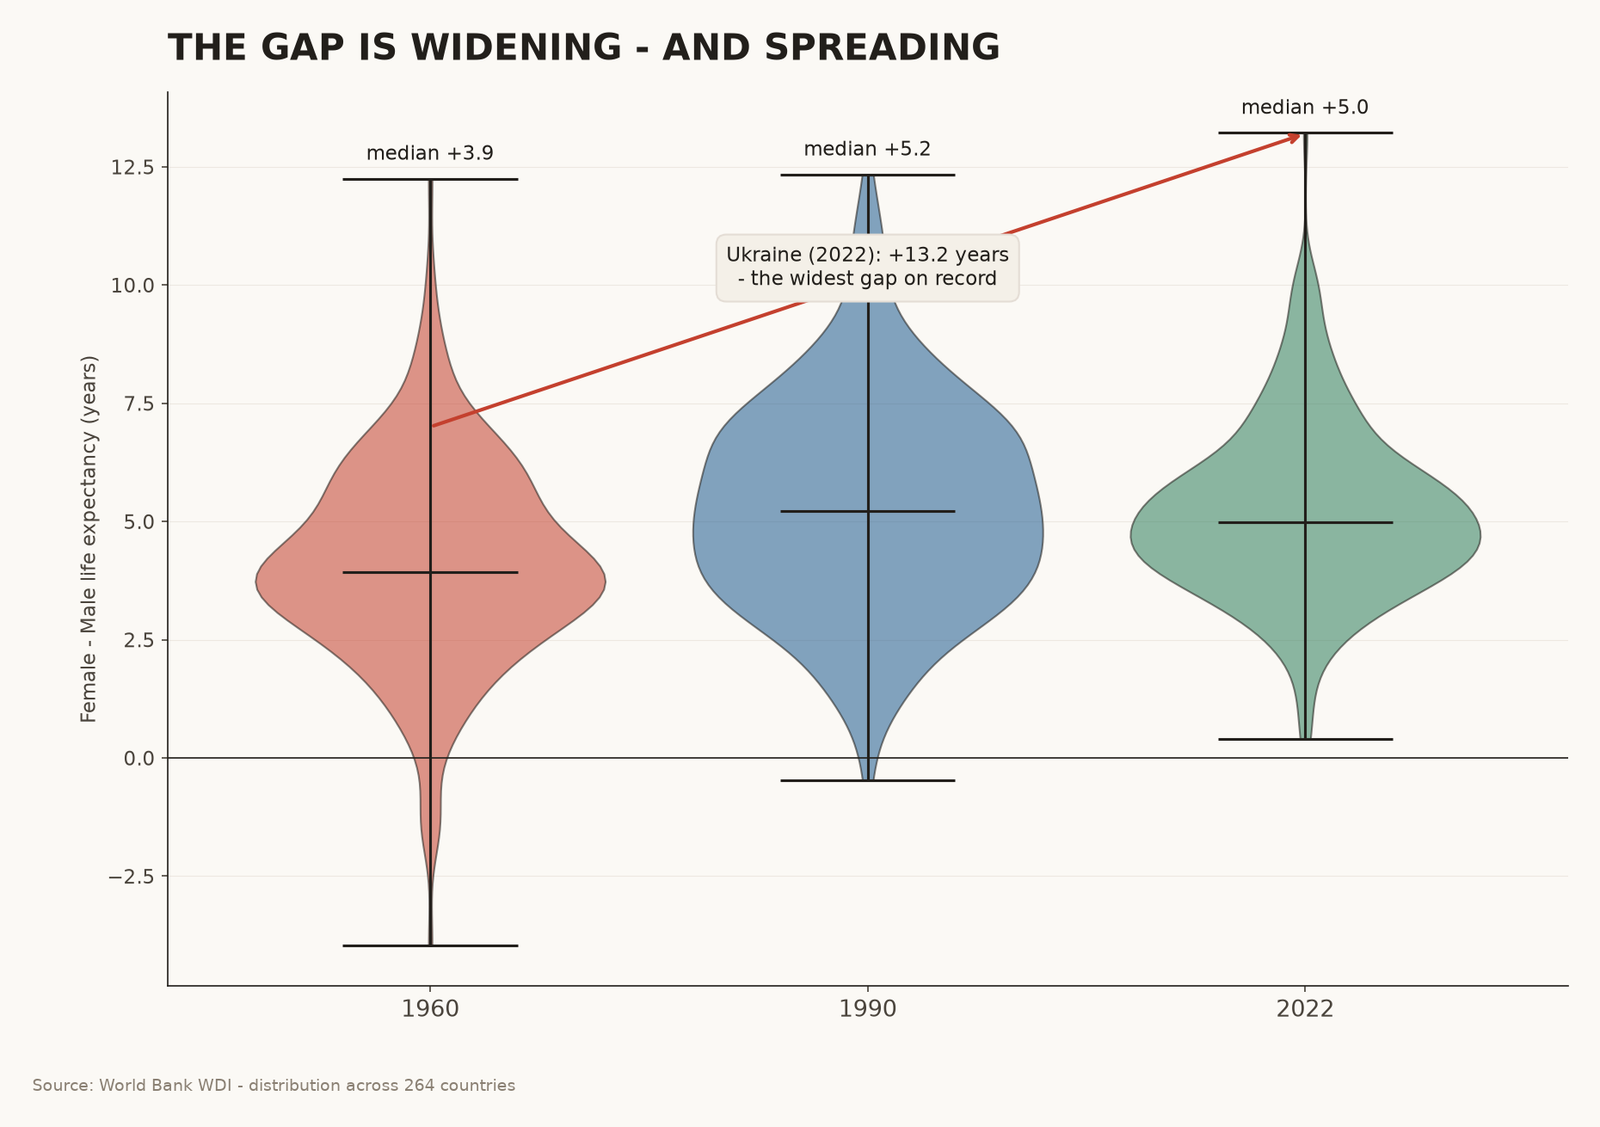
These are the same 264 countries plotted three times — once for 1960, once for 1990, once for 2022. Watch the violins stretch and drift upward. The median country gap has risen from +3.5 years in 1960 to +5.0 years in 2022.
No violin crosses the zero line. Not one — in any of the three snapshots — has a country where men outlive women. Women live longer than men, everywhere, always, in this dataset.
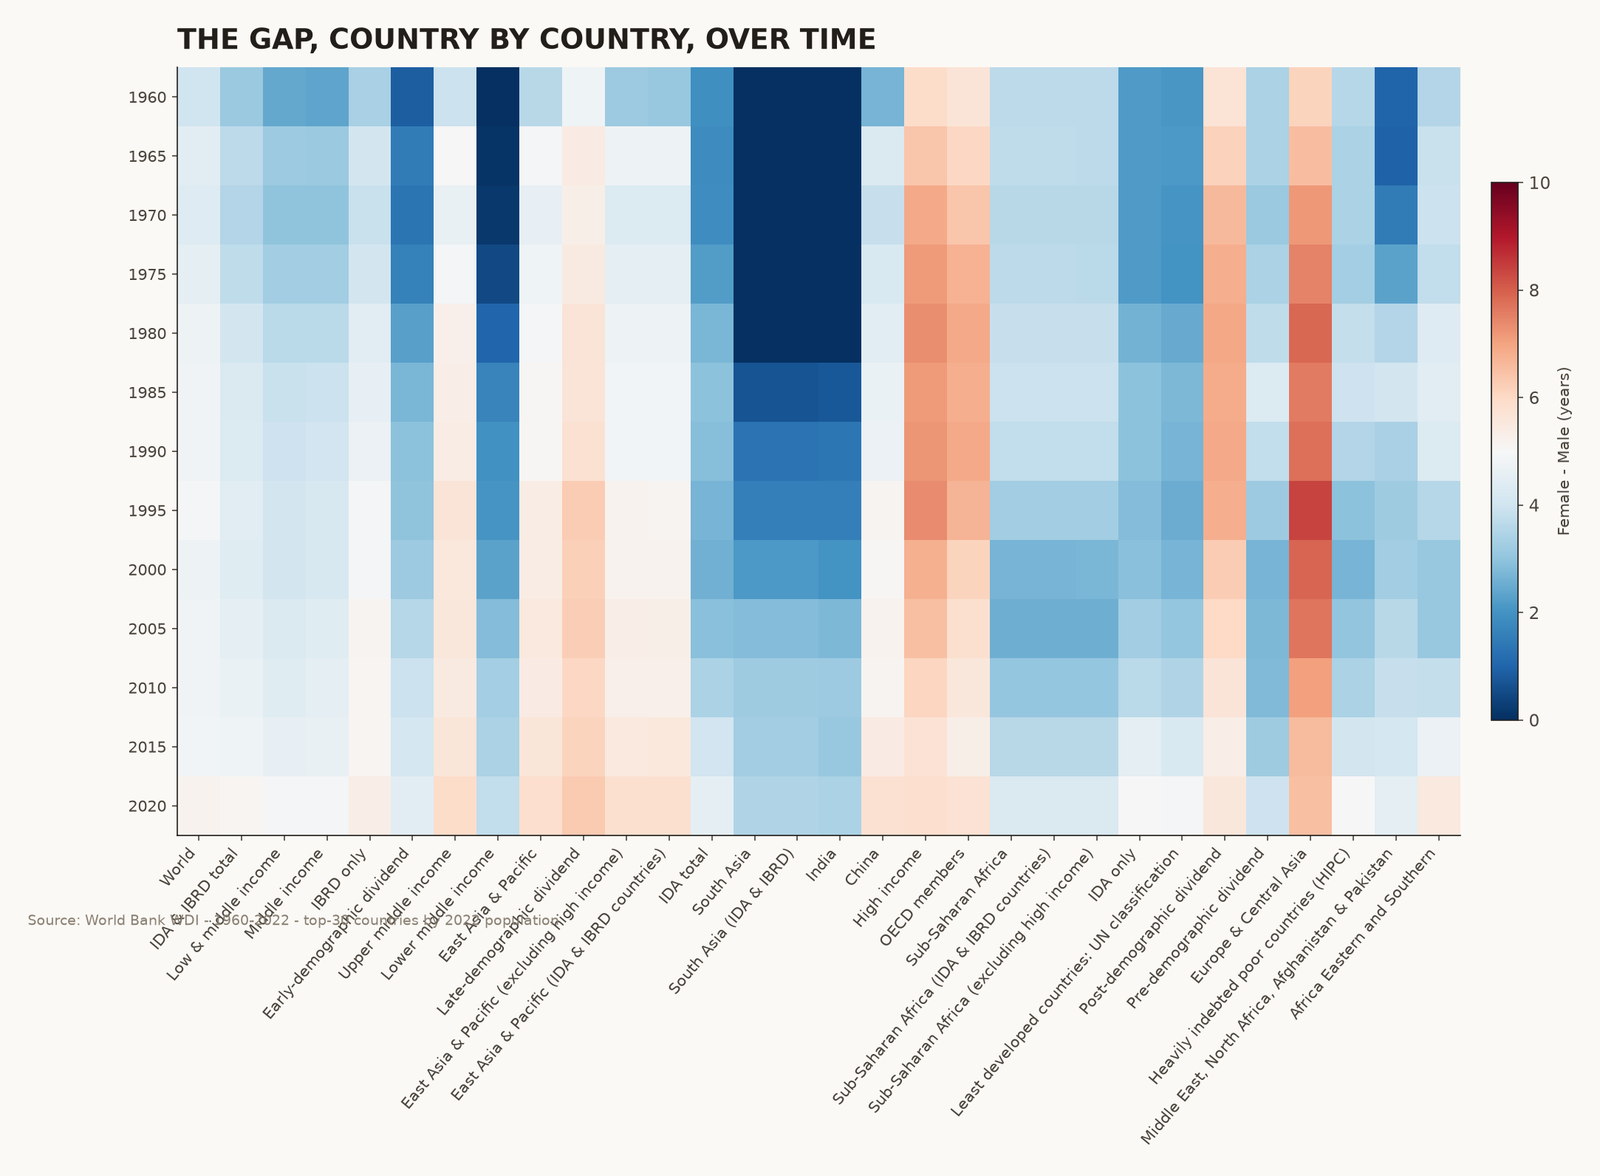
Widening fastest, 1960→2022
- Pakistan — -4.0 yr (1960) → +4.8 yr (2022) · +8.8 yr swing
- Central African Republic — +2.1 yr (1960) → +10.2 yr (2022) · +8.1 yr swing
- Ukraine — +6.1 yr (1960) → +13.2 yr (2022) · +7.1 yr swing
- Thailand — +3.4 yr (1960) → +8.8 yr (2022) · +5.4 yr swing
- Iran, Islamic Rep. — -1.3 yr (1960) → +3.9 yr (2022) · +5.2 yr swing
- Guam — +3.0 yr (1960) → +8.1 yr (2022) · +5.1 yr swing
- Bangladesh — -1.5 yr (1960) → +3.5 yr (2022) · +5.0 yr swing
- Sao Tome and Principe — +2.7 yr (1960) → +7.5 yr (2022) · +4.8 yr swing
- El Salvador — +4.0 yr (1960) → +8.8 yr (2022) · +4.7 yr swing
- Mongolia — +4.6 yr (1960) → +9.4 yr (2022) · +4.7 yr swing
Narrowing fastest, 1960→2022
- Cameroon — +12.3 yr (1960) → +4.3 yr (2022) · -8.0 yr swing
- Isle of Man — +10.4 yr (1960) → +4.2 yr (2022) · -6.1 yr swing
- Liechtenstein — +6.9 yr (1960) → +2.3 yr (2022) · -4.6 yr swing
- Palau — +9.0 yr (1960) → +4.9 yr (2022) · -4.1 yr swing
- United Arab Emirates — +6.6 yr (1960) → +2.7 yr (2022) · -3.9 yr swing
- San Marino — +6.6 yr (1960) → +3.0 yr (2022) · -3.6 yr swing
- Nigeria — +4.2 yr (1960) → +0.6 yr (2022) · -3.6 yr swing
- Cyprus — +7.6 yr (1960) → +4.2 yr (2022) · -3.3 yr swing
- Azerbaijan — +8.2 yr (1960) → +5.2 yr (2022) · -3.0 yr swing
- Kuwait — +3.9 yr (1960) → +1.0 yr (2022) · -2.9 yr swing
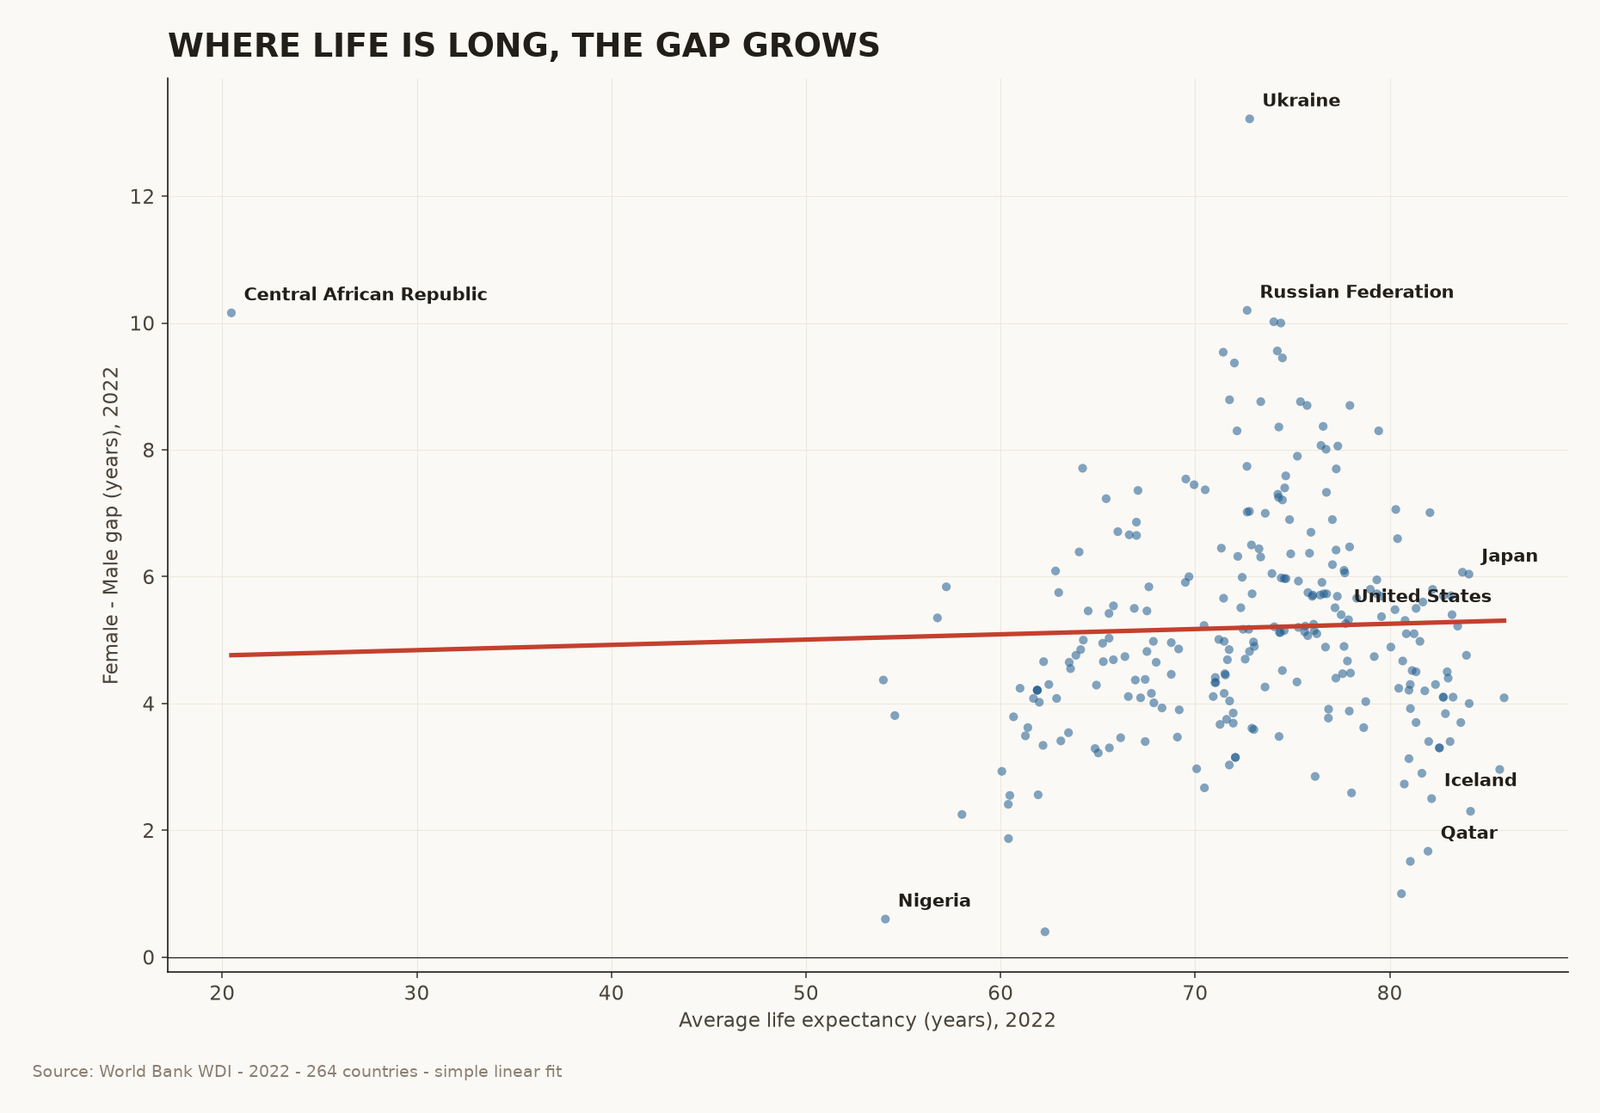
Where life is long, the gap grows.
Plot every country by how long its people live on average (the x-axis) against how big its gender gap is (the y-axis). The two should be unrelated. They are not. The longer a country lives, the bigger its gap.
The trend line slopes upward. Each extra year of average life expectancy adds about 0.06 years to the female advantage. Tiny per year — enormous over six decades.
Drag the slider. Try the what-if.
What does the gap look like at home? Use the slider below to compare 1990 and 2022 for fourteen major countries. Or click the year buttons. Each panel uses the real World Bank numbers for those two years.
Then ask the what-if: if every man in 2022 lived exactly as long as the average woman in his country, how many years of life would be added?
Side by side: 1990 vs 2022
What you can do with this.
A fact this universal deserves more than a chart. Here are four things a working journalist, a teacher, or just a person at a dinner party can do with what you just learned.
Four things to do this week
- Ask where the men went. When you see a country-level life expectancy number — always ask for the sex breakdown. A 78-year average can hide a 13-year gap (Ukraine) or a 0.4-year gap (Togo).
- Push back on the “biological” story. The 4.9-year global gap is mostly behavioural — smoking, alcohol, traffic, violence, occupational risk. Roughly two years is biological; the rest is preventable. Cite the OECD and WHO cause-of-death data next time someone claims the gap is “just nature”.
- Watch the post-Soviet states. Ukraine, Russia, Belarus, Latvia, Lithuania, Moldova. Six countries hold the world’s largest gaps. Alcohol policy reform is the lever that has worked historically.
- Use Pakistan as your headline. If you want a single number to make the story real, use Pakistan: from −4.0 (men outlived women) in 1960 to +4.8 in 2022. The largest peaceful demographic reversal in any country, ever.
Methodology & Sources
All numbers come from a single source: World Bank World Development Indicators (WDI), downloaded September 2025. Life expectancy figures use indicators SP.DYN.LE00.FE.IN (female) and SP.DYN.LE00.MA.IN (male). Population figures use SP.POP.TOTL. The dataset contains 264 countries with continuous coverage from 1960–2022.
Transformations
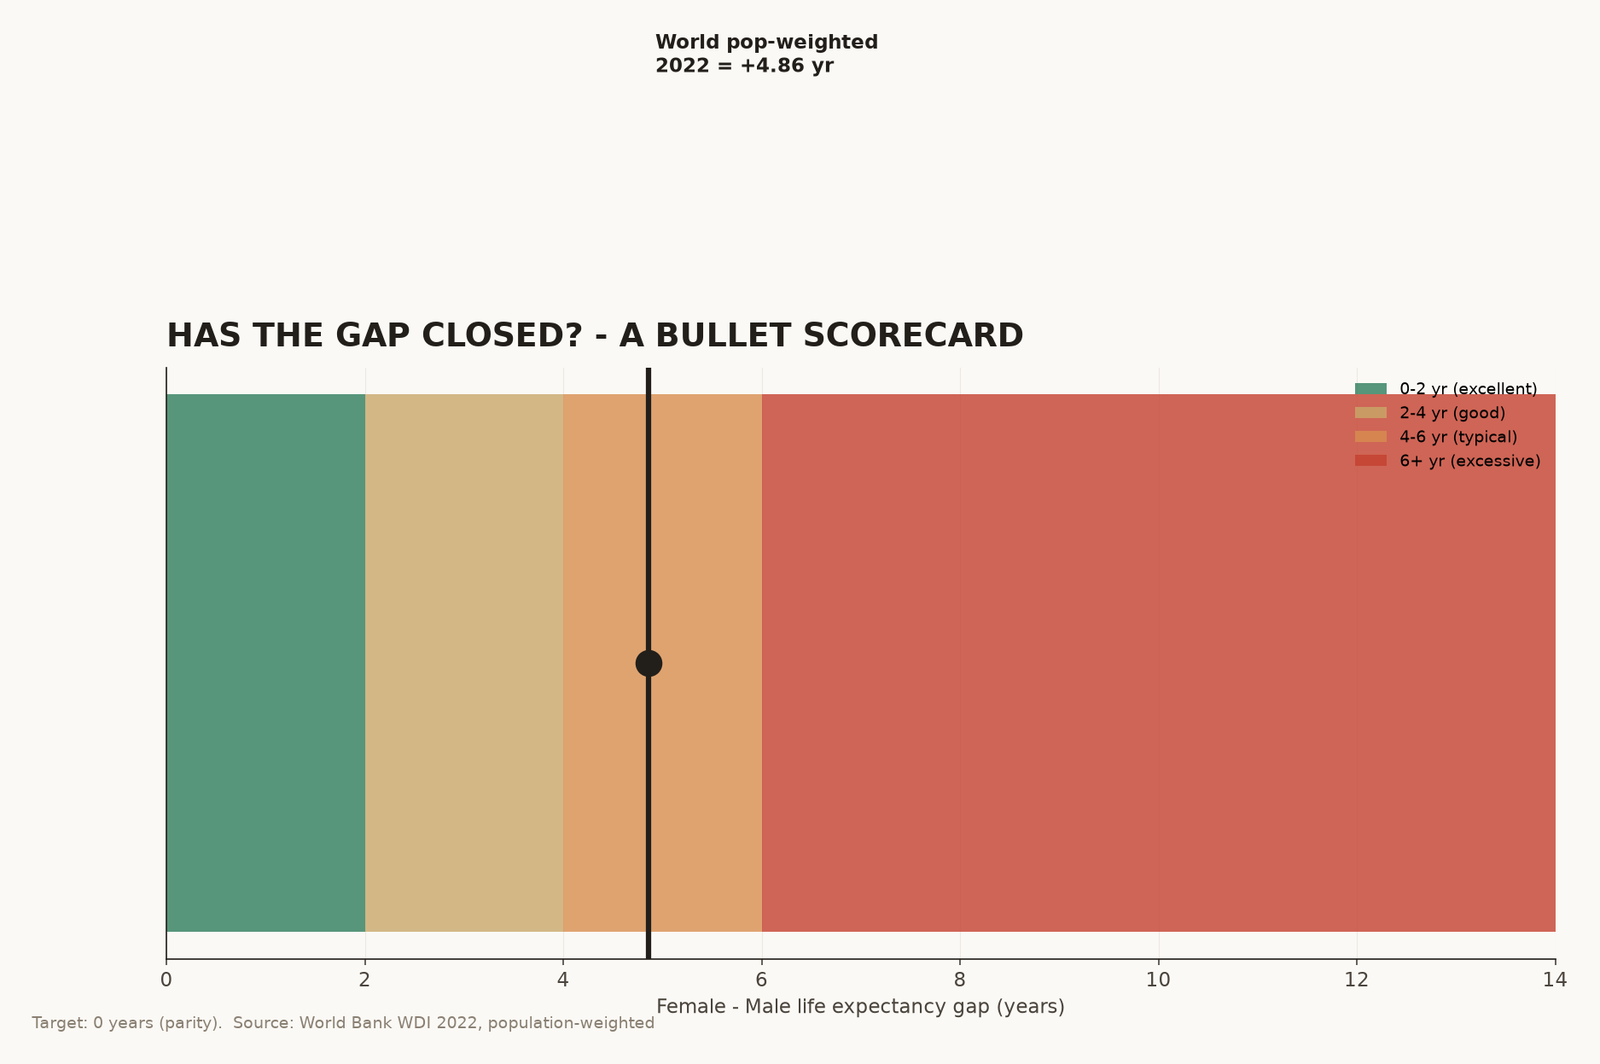
- World averages. Two forms: simple mean across countries (used in the violin and small multiples) and population-weighted mean (used in the signature chart and the waterfall). The population-weighted figure weights each country’s life expectancy by its 2022 population.
- Region classification. Regions follow a hybrid of World Bank and UN groupings. Country-to-region mapping is hand-curated in the source data.
- Waterfall decomposition. The global population-weighted gap of 4.86 years is decomposed as the sum of (region gap × region population share). Each bar’s contribution is its share of that total.
- Linear fit (Chapter 5). Simple ordinary-least-squares regression of country-level 2022 gap on country-level 2022 average life expectancy. Slope: +0.06 years per year of average LE.
Caveats
- The 2020 dip in male life expectancy is COVID-19. It is not a permanent trend reversal — the 2022 numbers already show partial recovery.
- Gulf state gaps (Qatar, Kuwait, Bahrain) are partly an artefact of selective migration — male migrant labourers skew the male life expectancy distribution.
- “World pop-weighted” weights heavily on China and India. The simple-mean view gives different numbers (e.g. +5.0 vs +4.9). Both are honest; we use weighted in the headline.
- The 2022 figures from the World Bank are the latest available at time of writing and may be revised.
Sources
World Bank — World Development Indicators, Life expectancy at birth, female (years) (SP.DYN.LE00.FE.IN) and Life expectancy at birth, male (years) (SP.DYN.LE00.MA.IN). databank.worldbank.org. Accessed September 2025.
